

Introduction
SectionPro includes a library of 535 structural steel sections organised into eleven families. Each entry retains its actual dimensions, curved transitions and fillet radii. When inserted as a GeoDomain in an advanced section, it can be combined with concrete domains and reinforcement using its own material law.
The embedded example “02 - Composite beam” illustrates this construction. The HEB 600 carries the first load, then the composite section carries the following increment and the effects of slab shrinkage. The – curves complete the ULS analysis.
Composite-section model
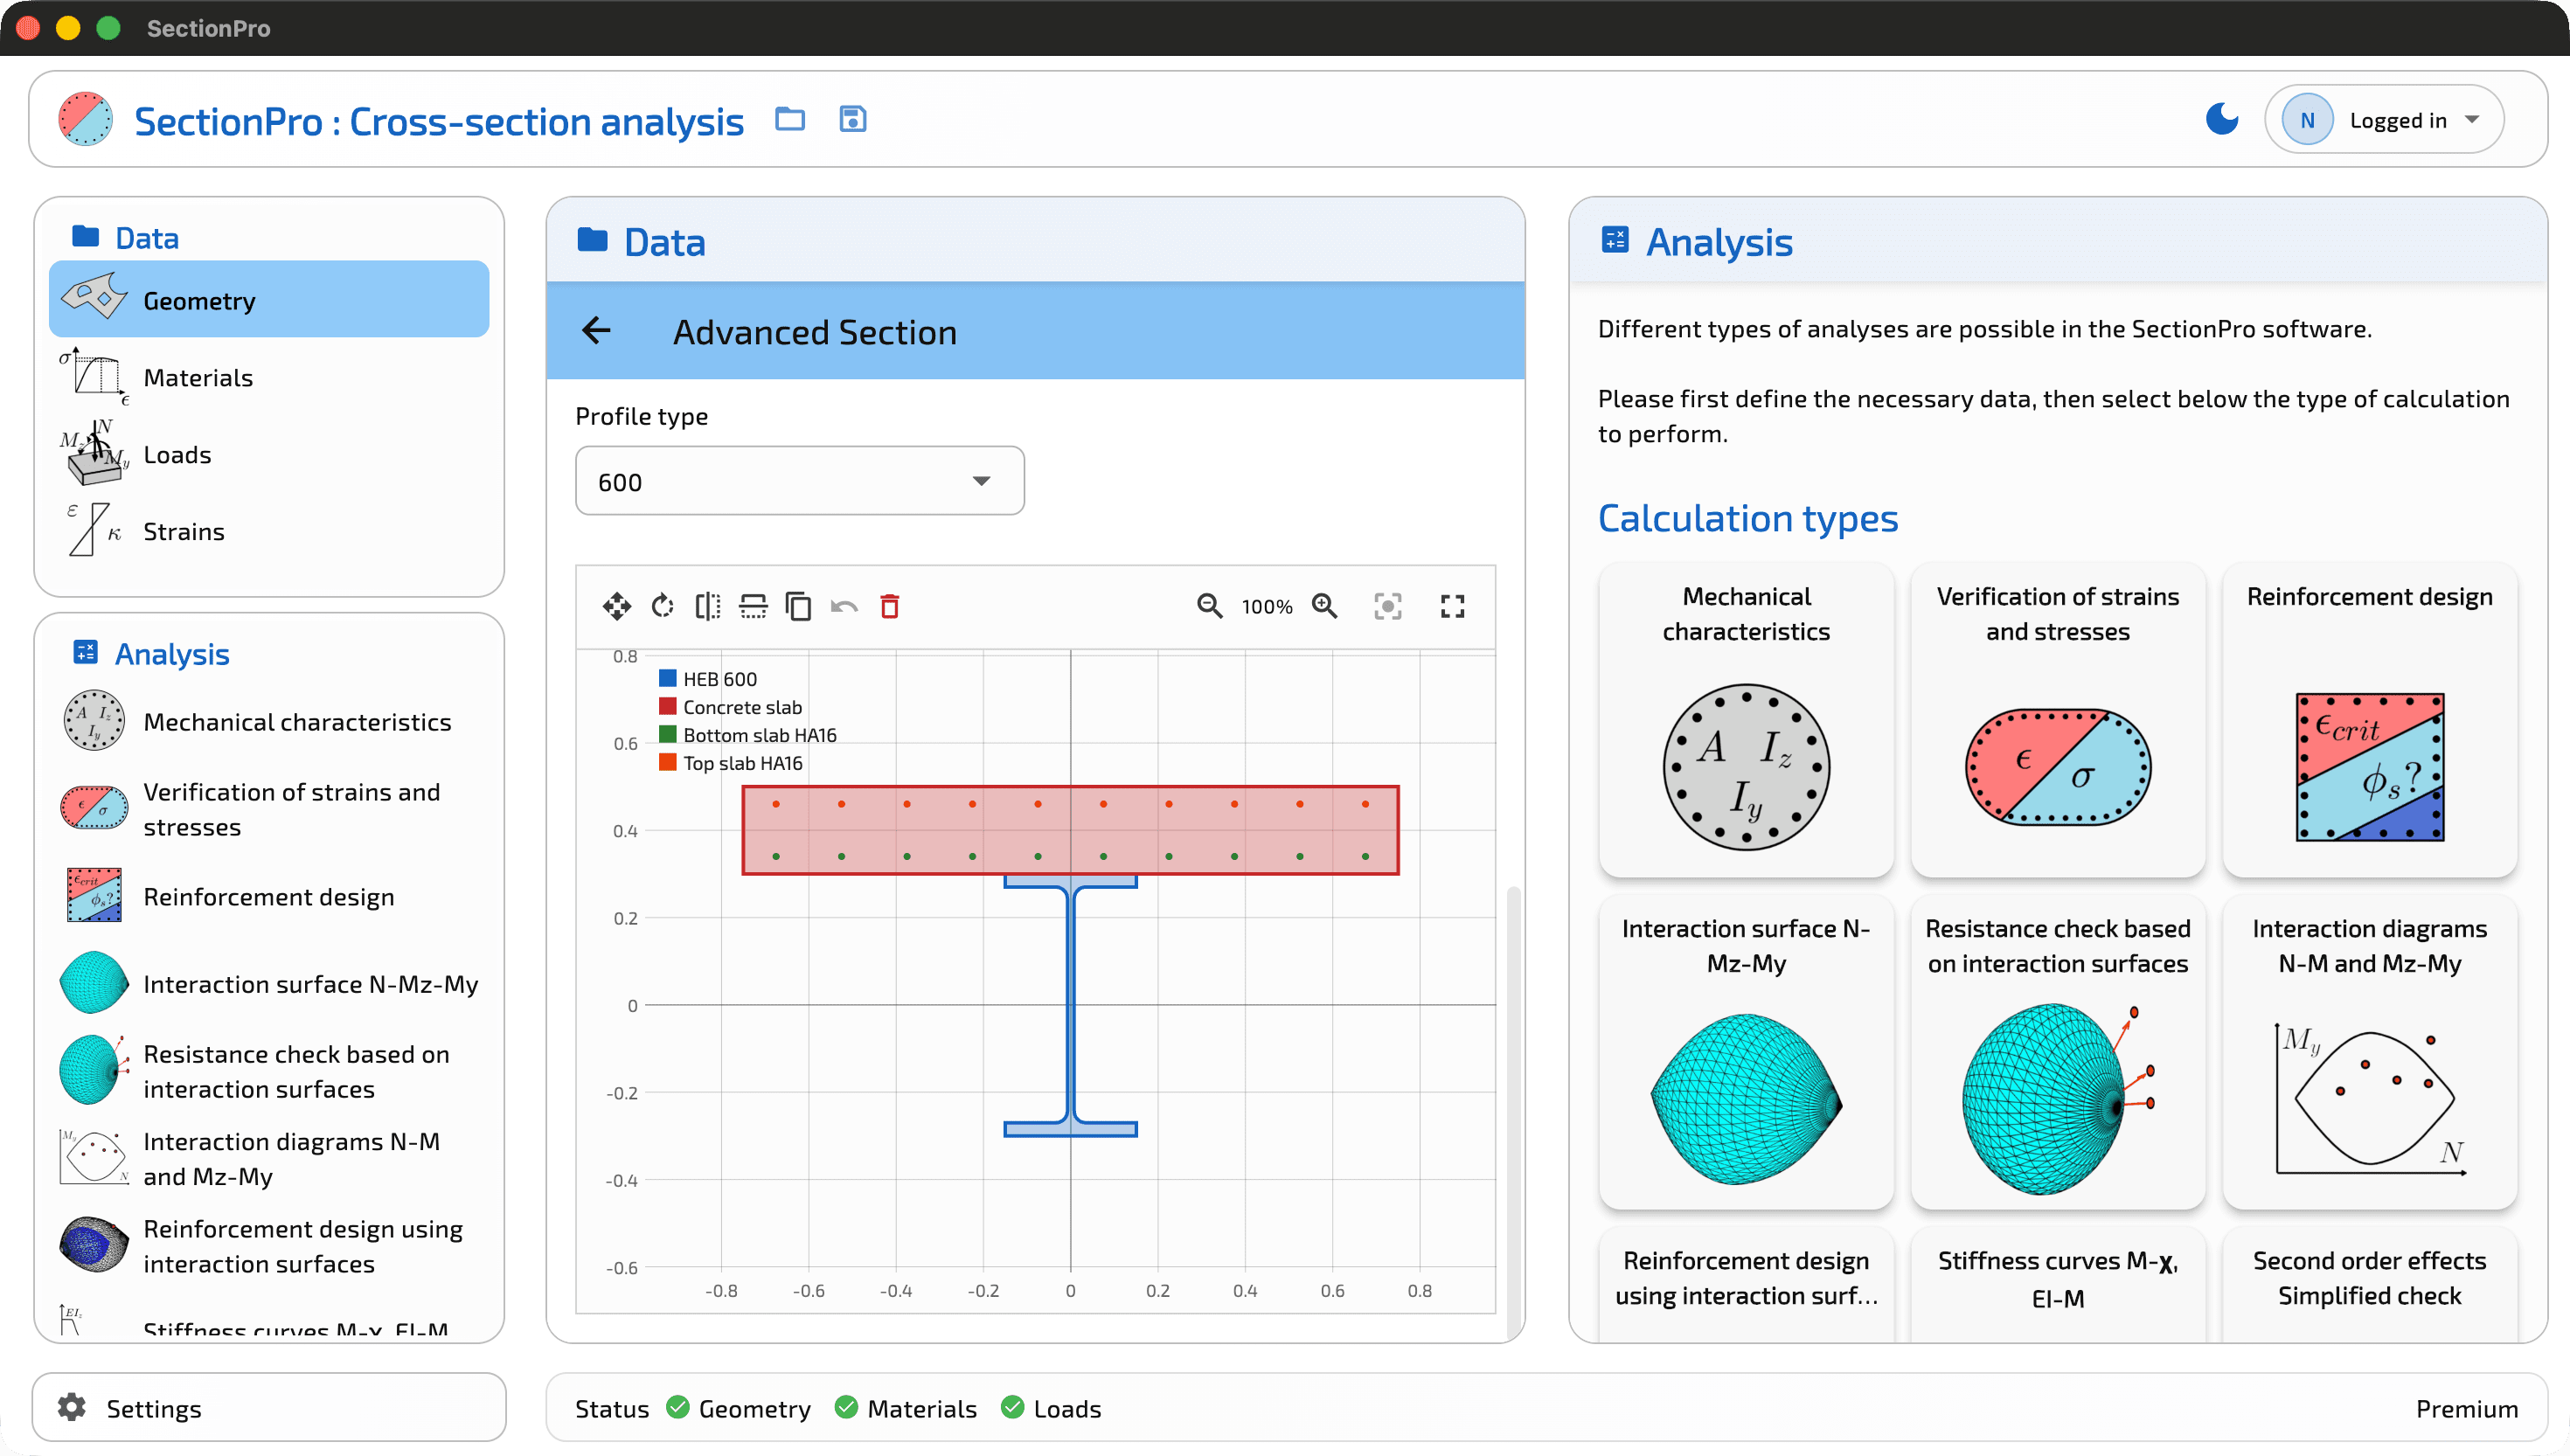
The HEB 600 is selected directly from the SectionPro library. Its actual outline is used, including the fillets between the web and flanges. A 1.50 m wide, 0.20 m deep slab is placed on the top flange. Two layers of ten HA16 bars at 150 mm spacing complete the section.
| Component | Material | Definition in the example |
|---|---|---|
| GeoDomain 1 | S355 steel | HEB 600, 0.60 m deep and 0.30 m wide |
| GeoDomain 2 | C30/37 concrete | Rectangular slab, 1.50 m × 0.20 m |
| Reinforcement | B500 steel | Two layers of 10 HA16 bars at 150 mm spacing |
Positive stresses denote tension and negative stresses denote compression. A positive moment places the HEB bottom flange in tension. SectionPro provides the minimum and maximum strain and stress values for every component.
Staged stress analysis
Stage A: structural steel section
The first state represents the active steel section before the slab has hardened. The applied moment is kN·m. HEB symmetry produces an antisymmetric distribution: the bottom flange reaches MPa and the top flange reaches MPa.
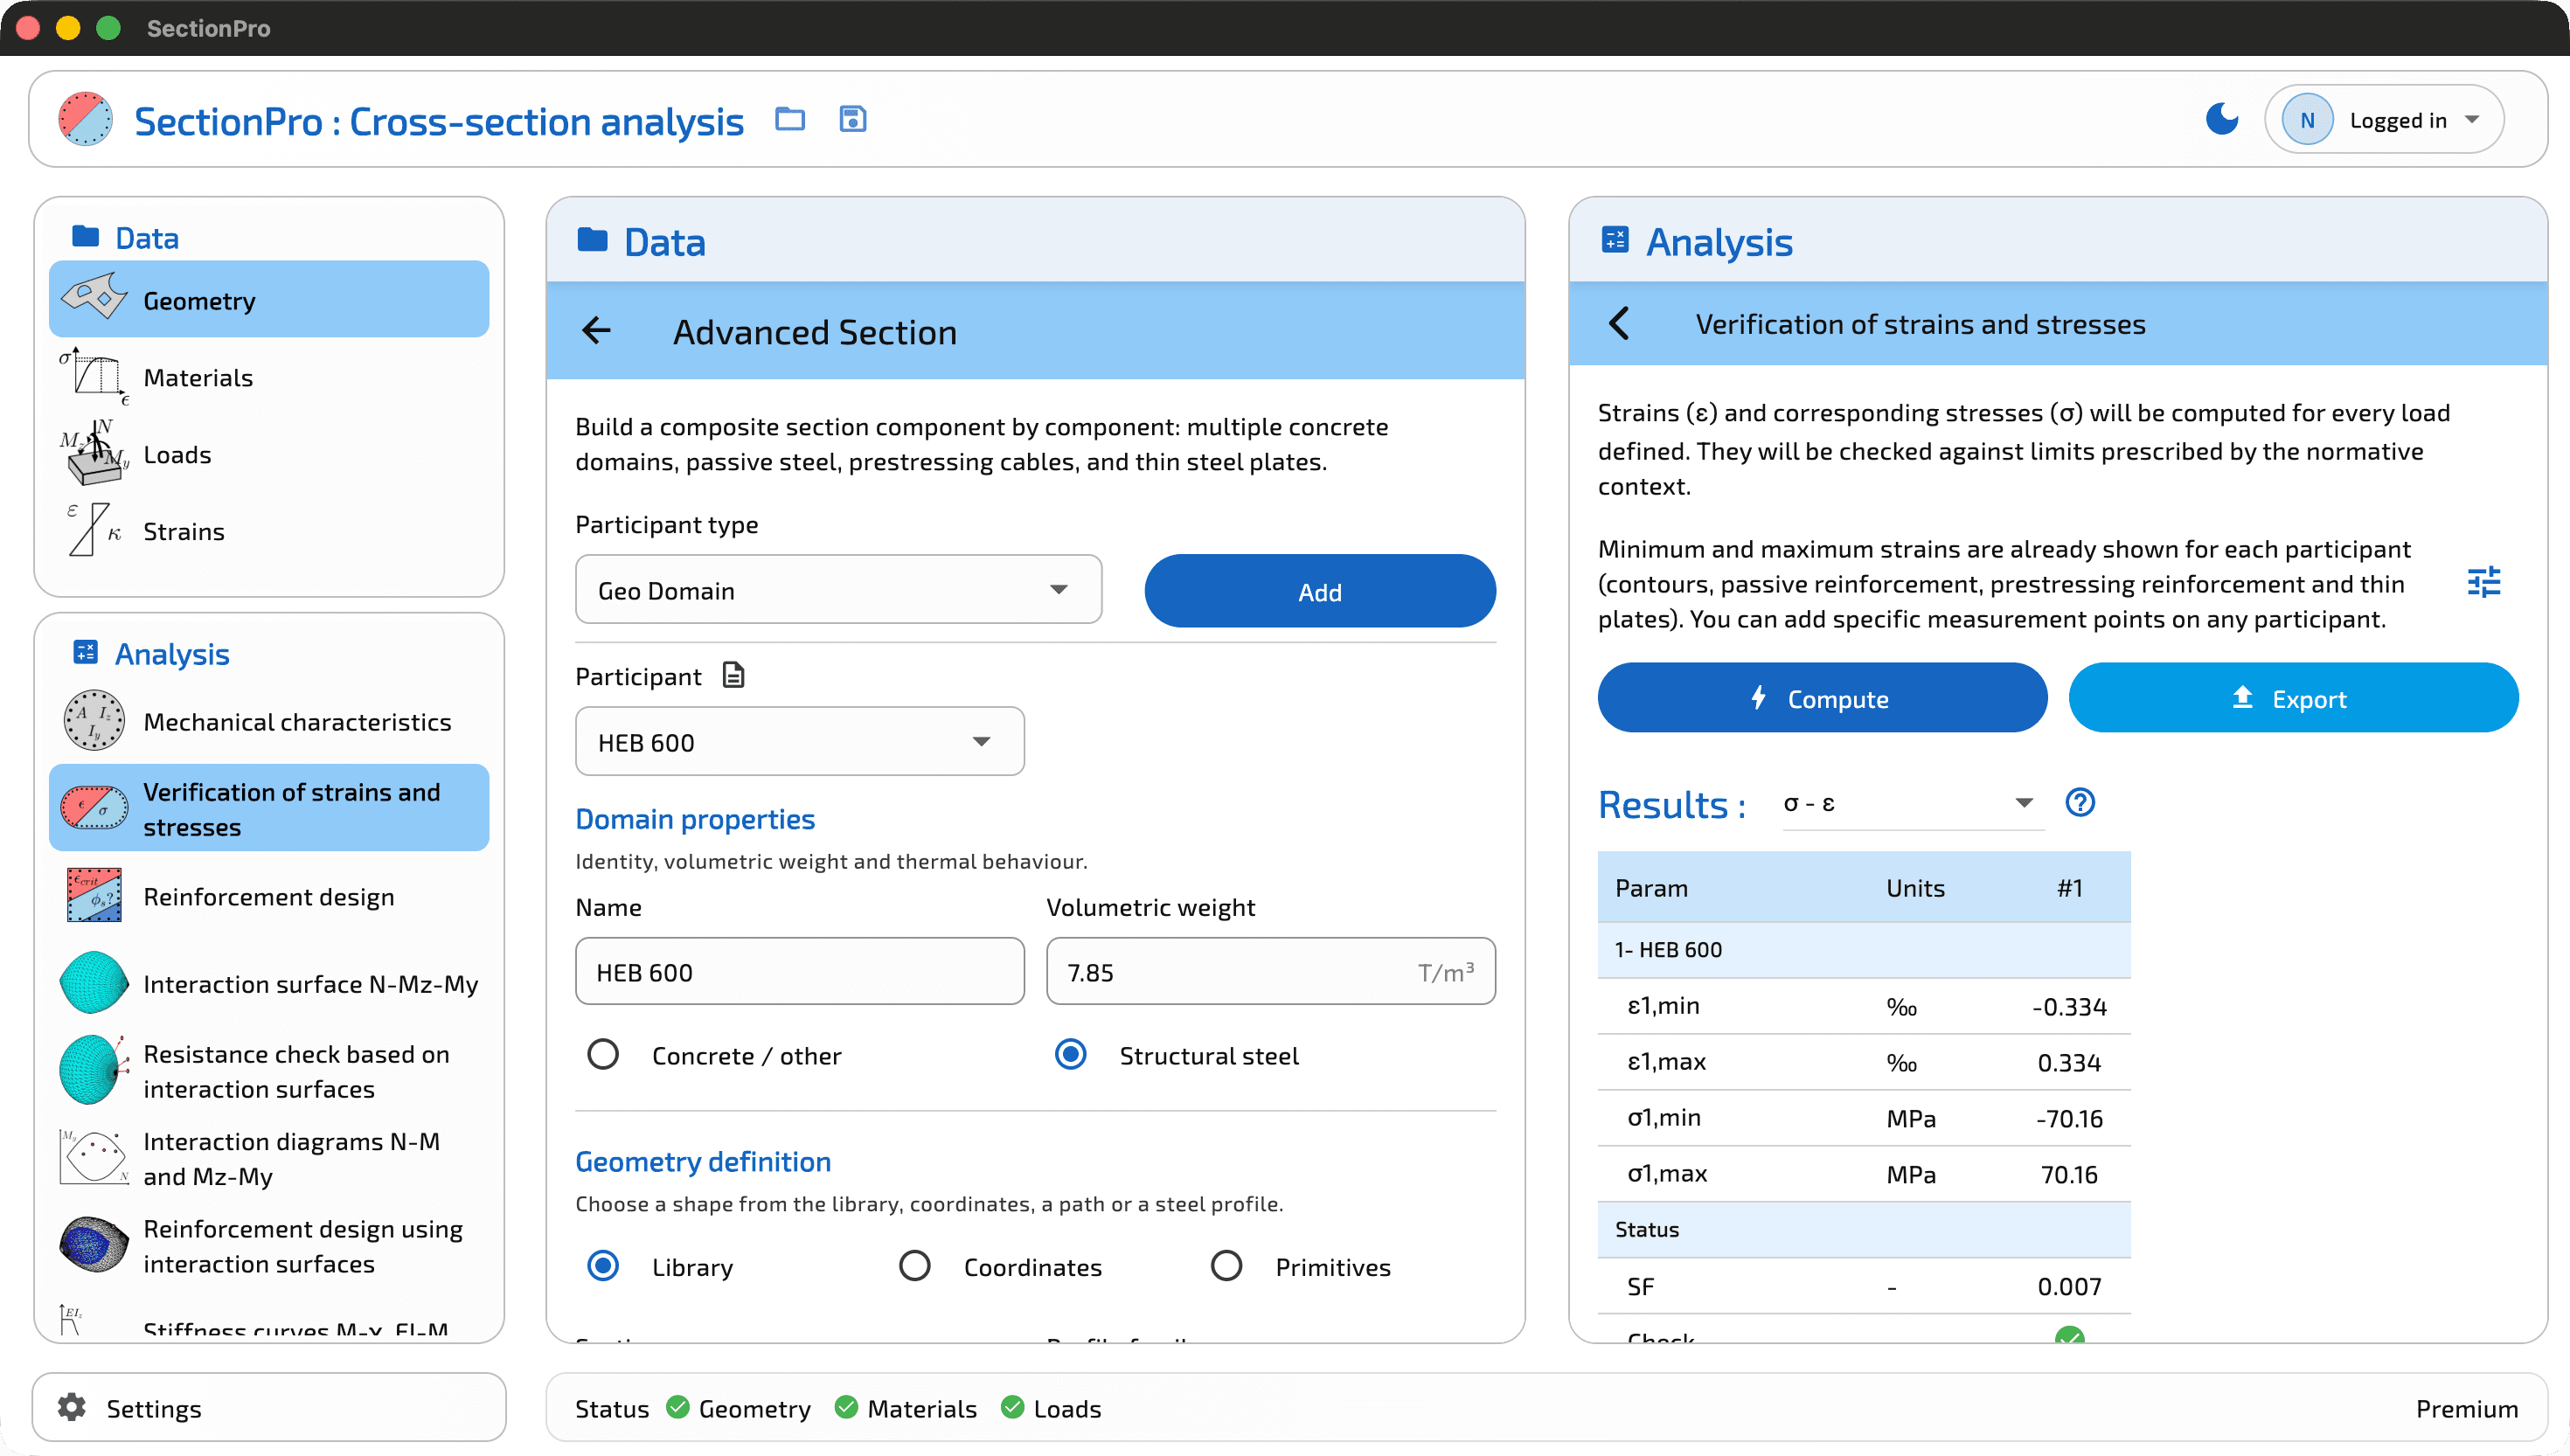
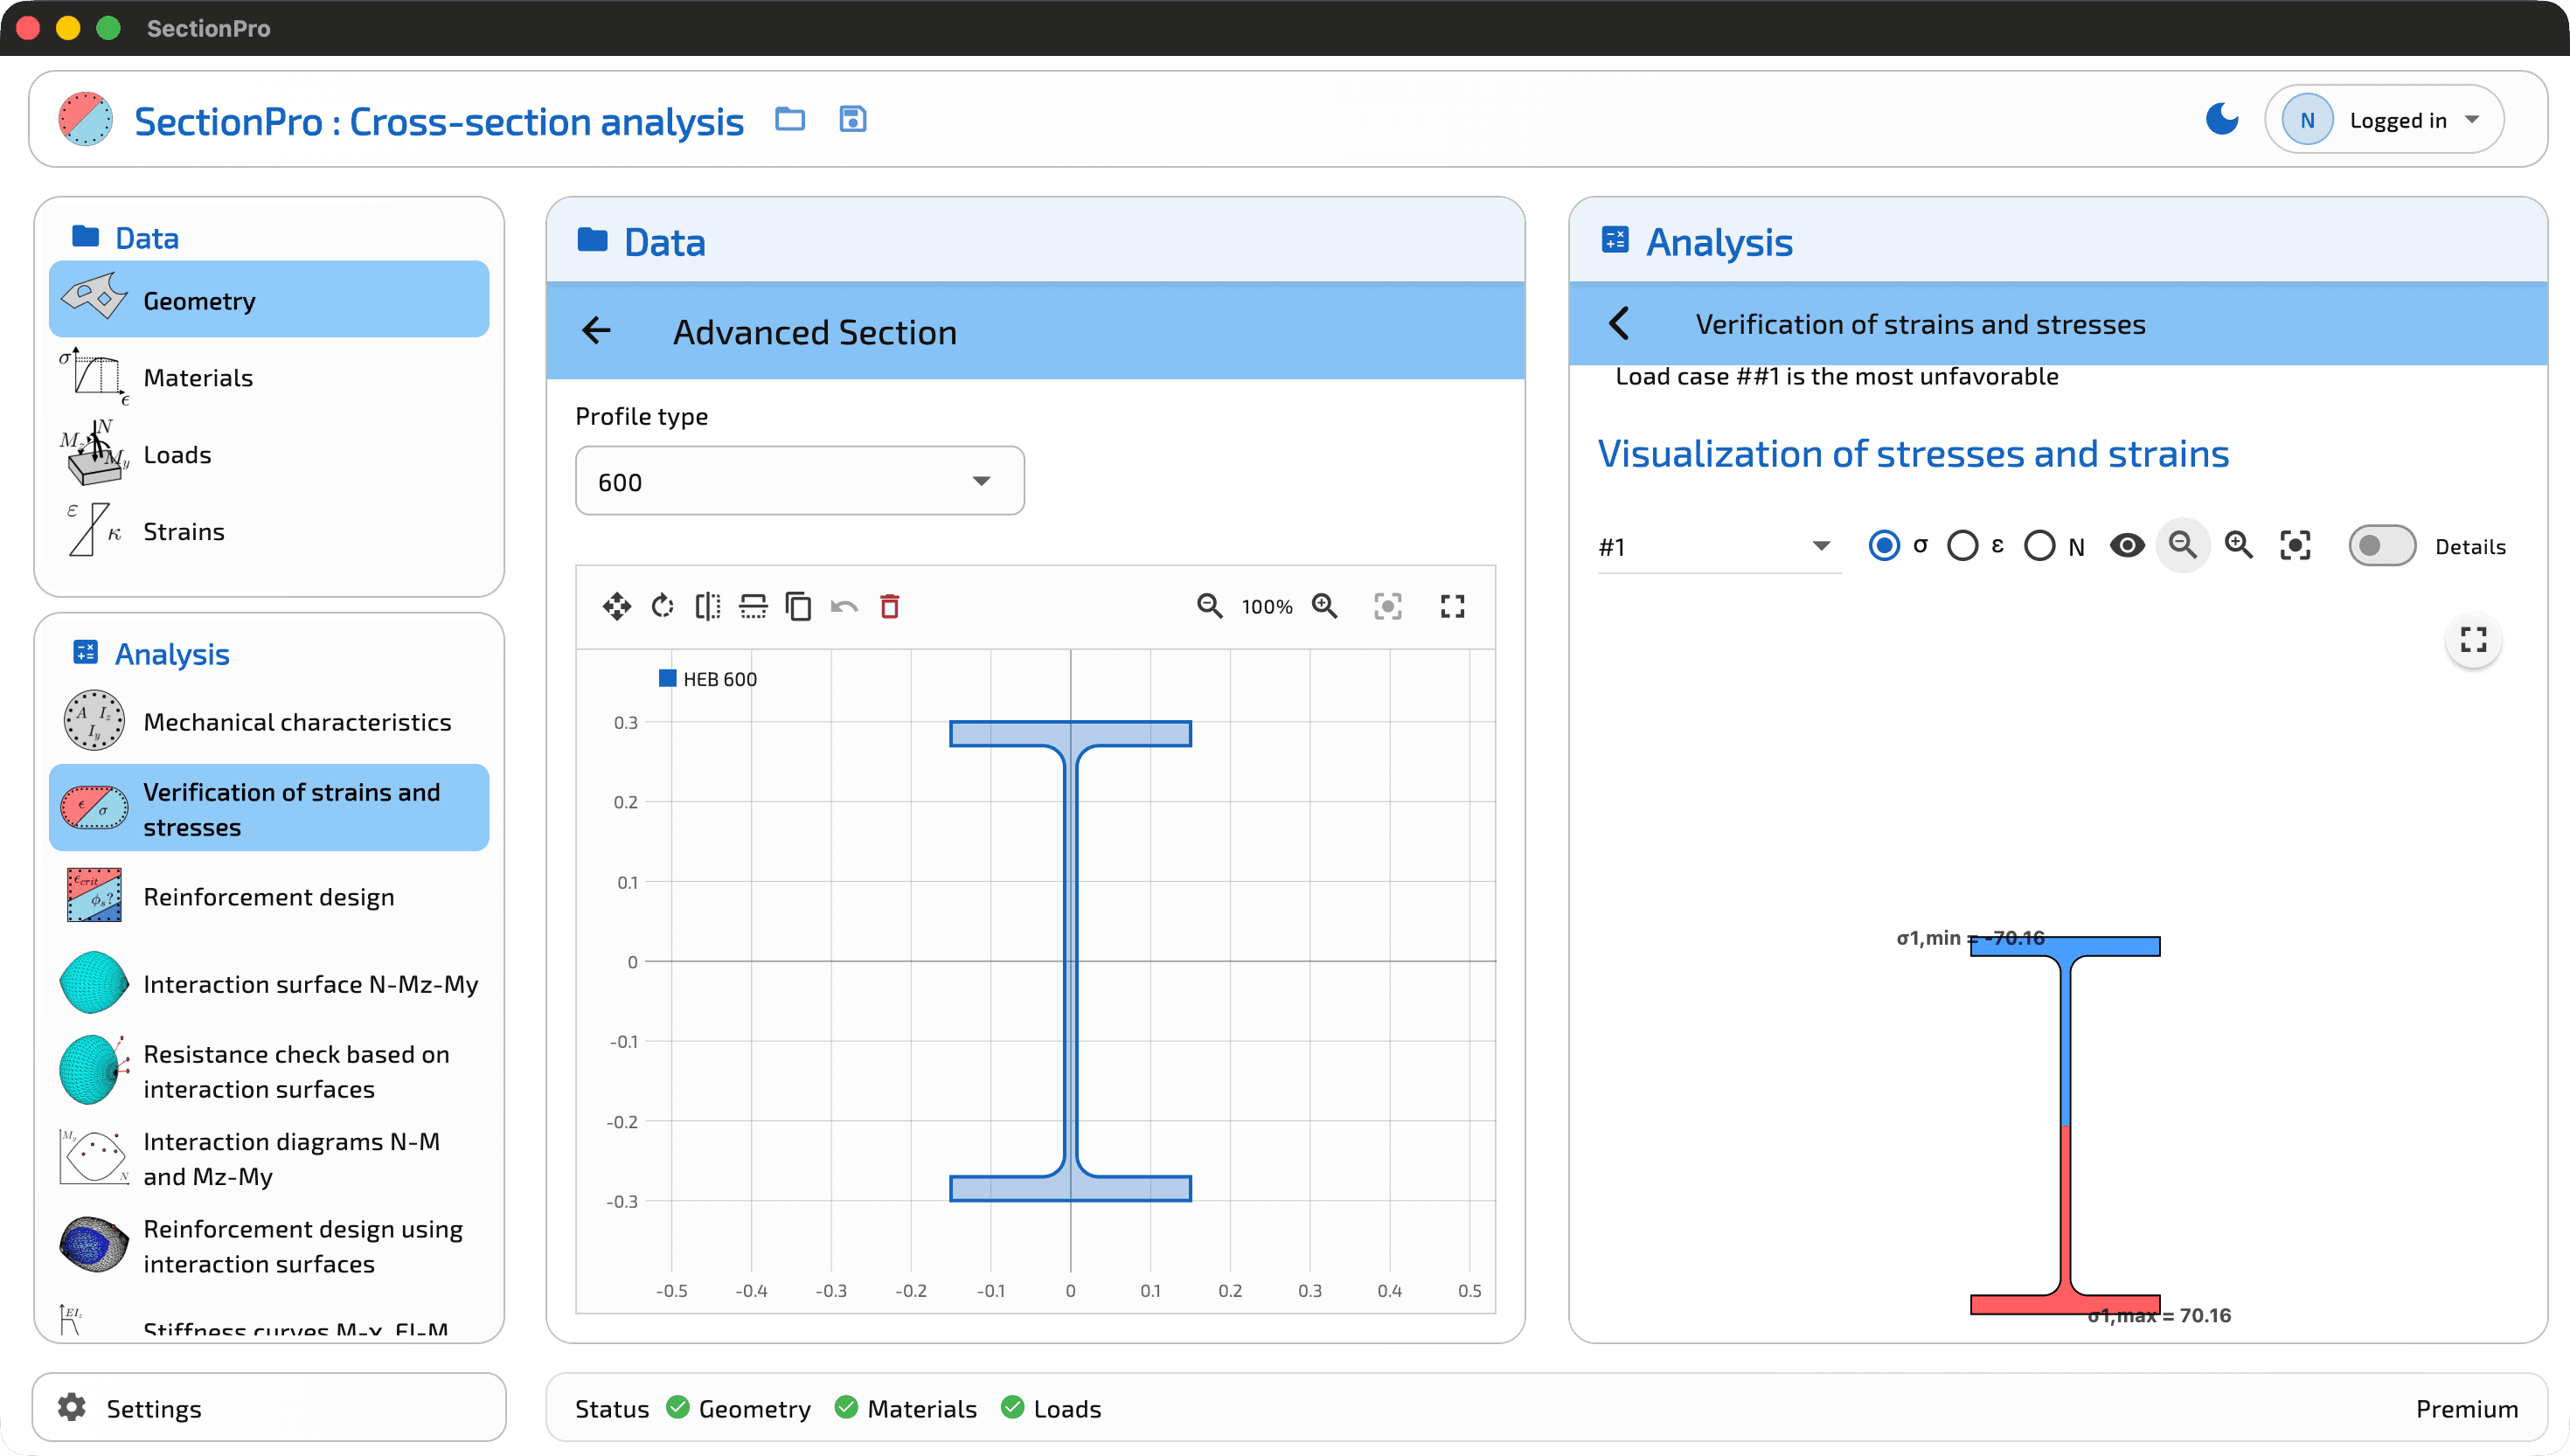
This state represents the stresses acquired by the steel section during the first construction stage.
Stage B: composite section
Once the slab has hardened, the reinforcement and steel section form the active composite section for the second stage. The applied increment is kN·m.
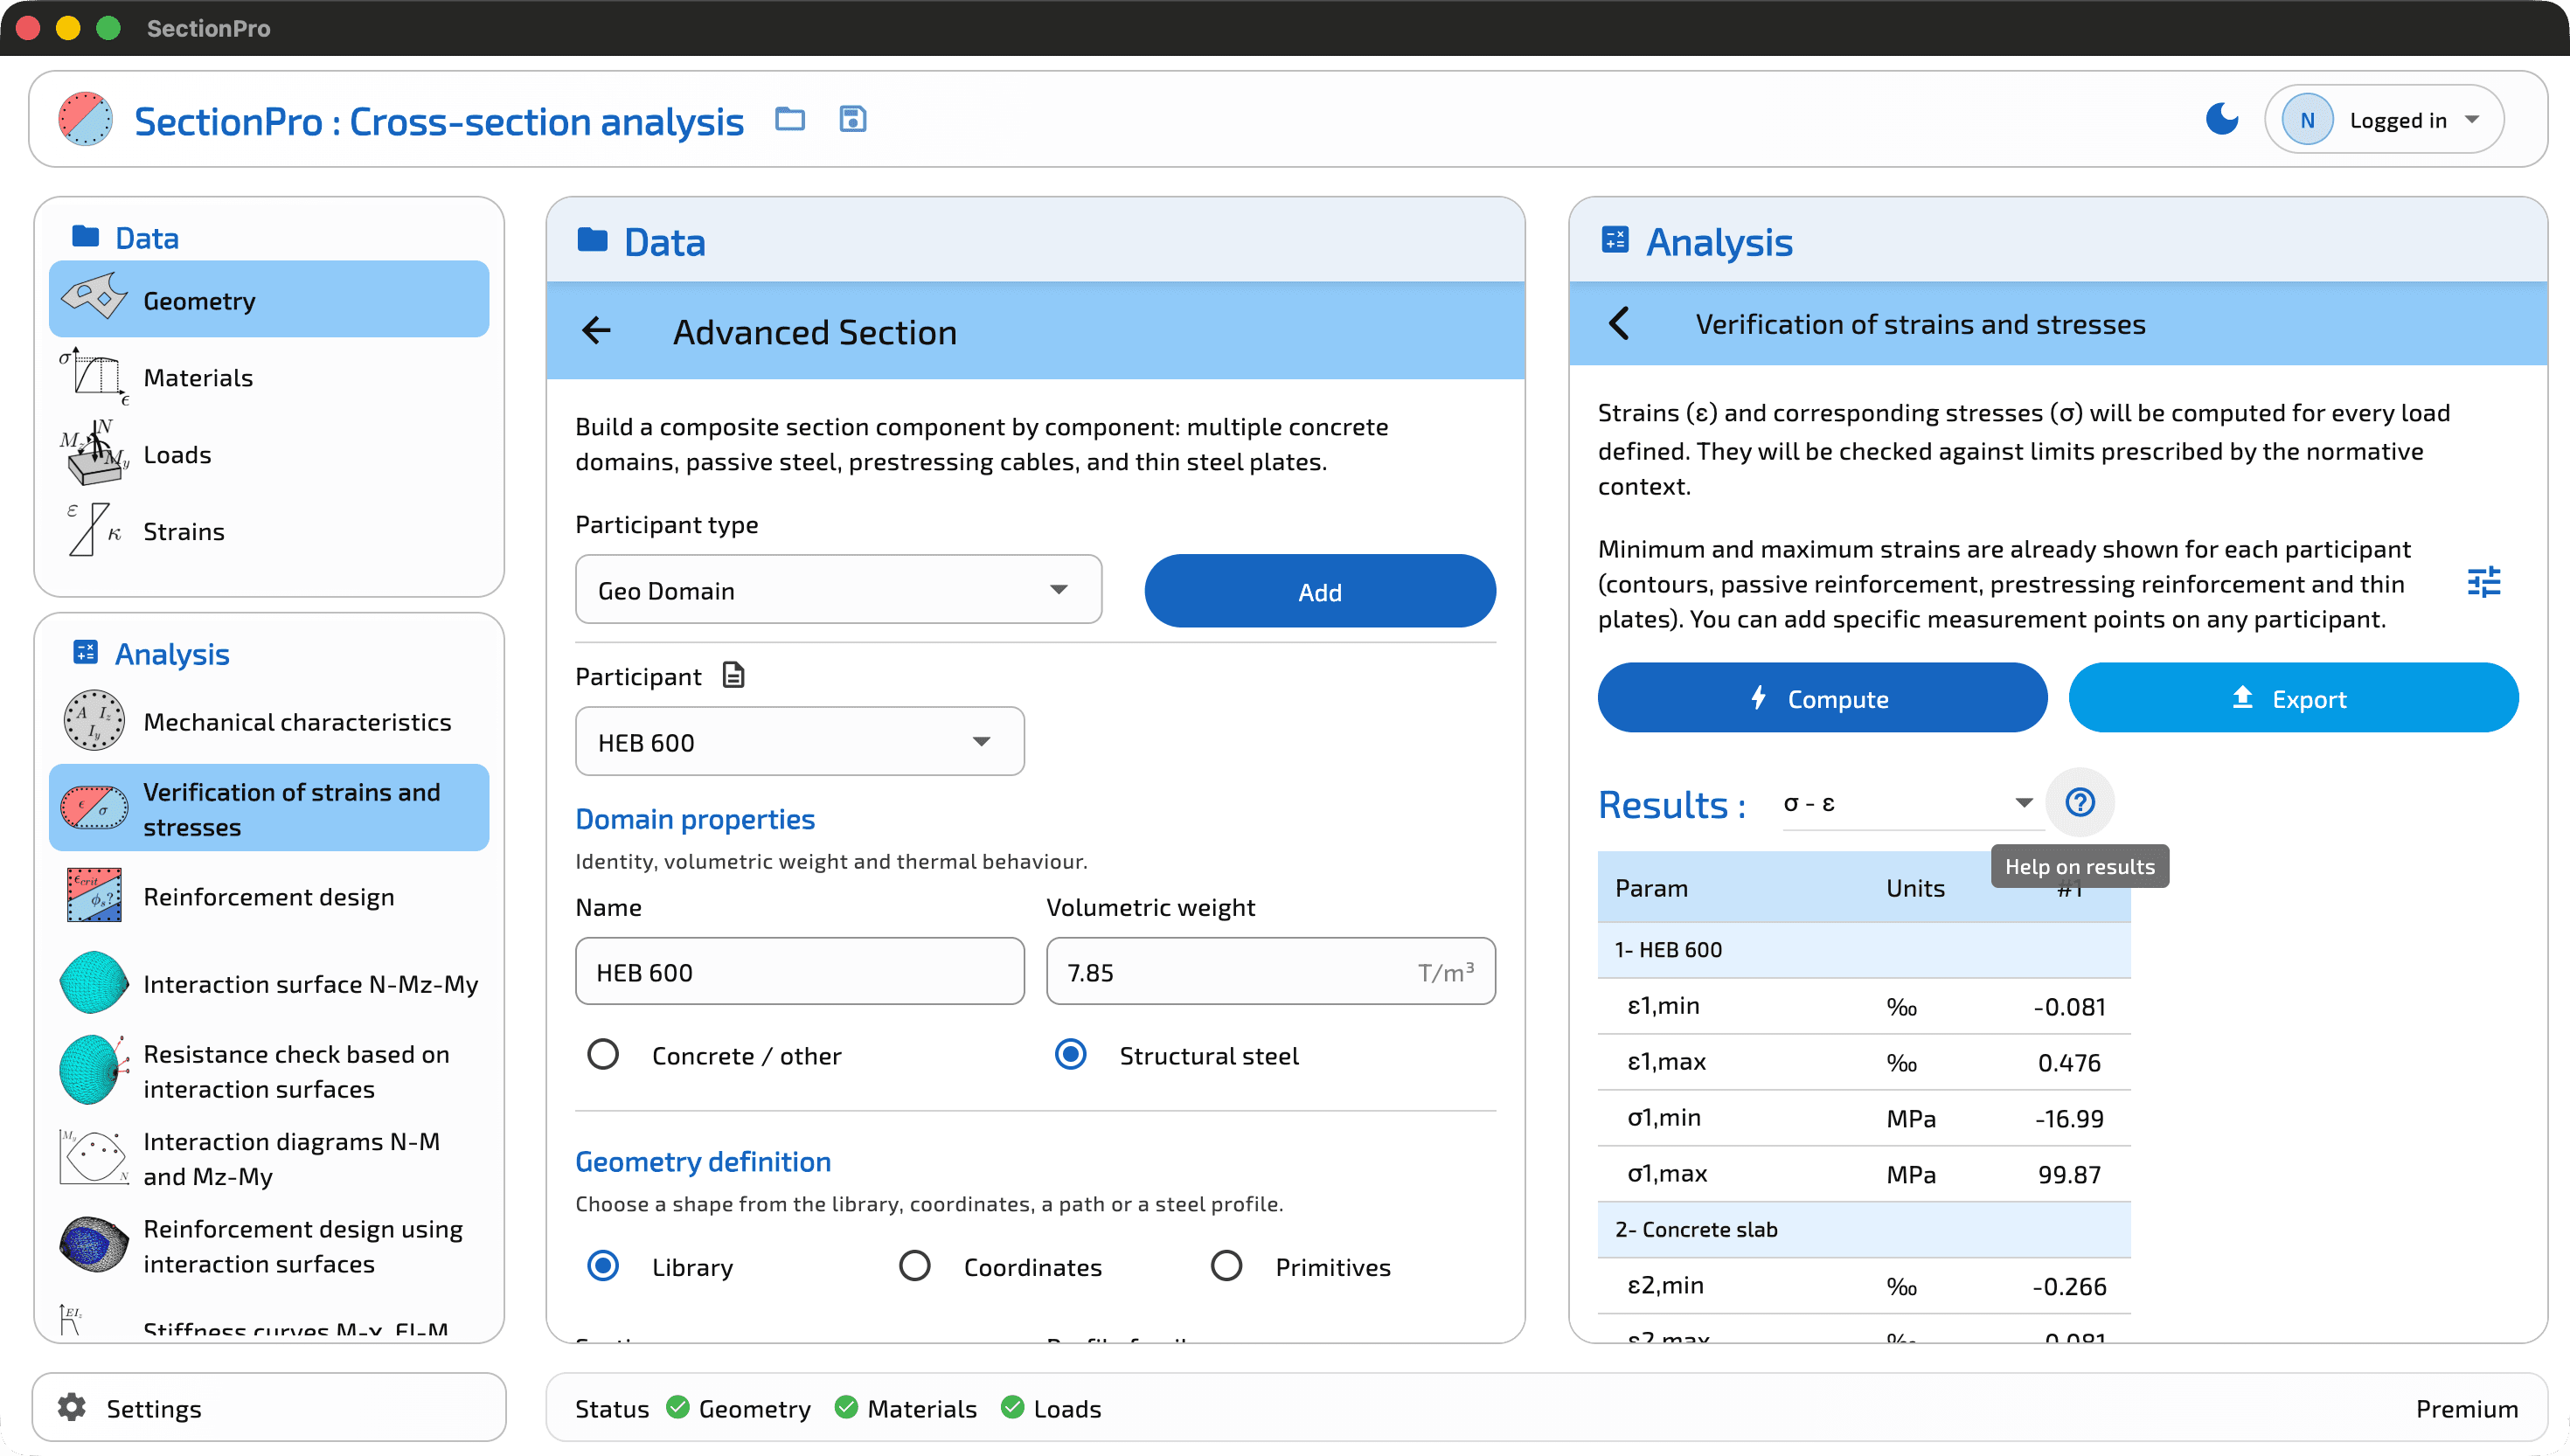
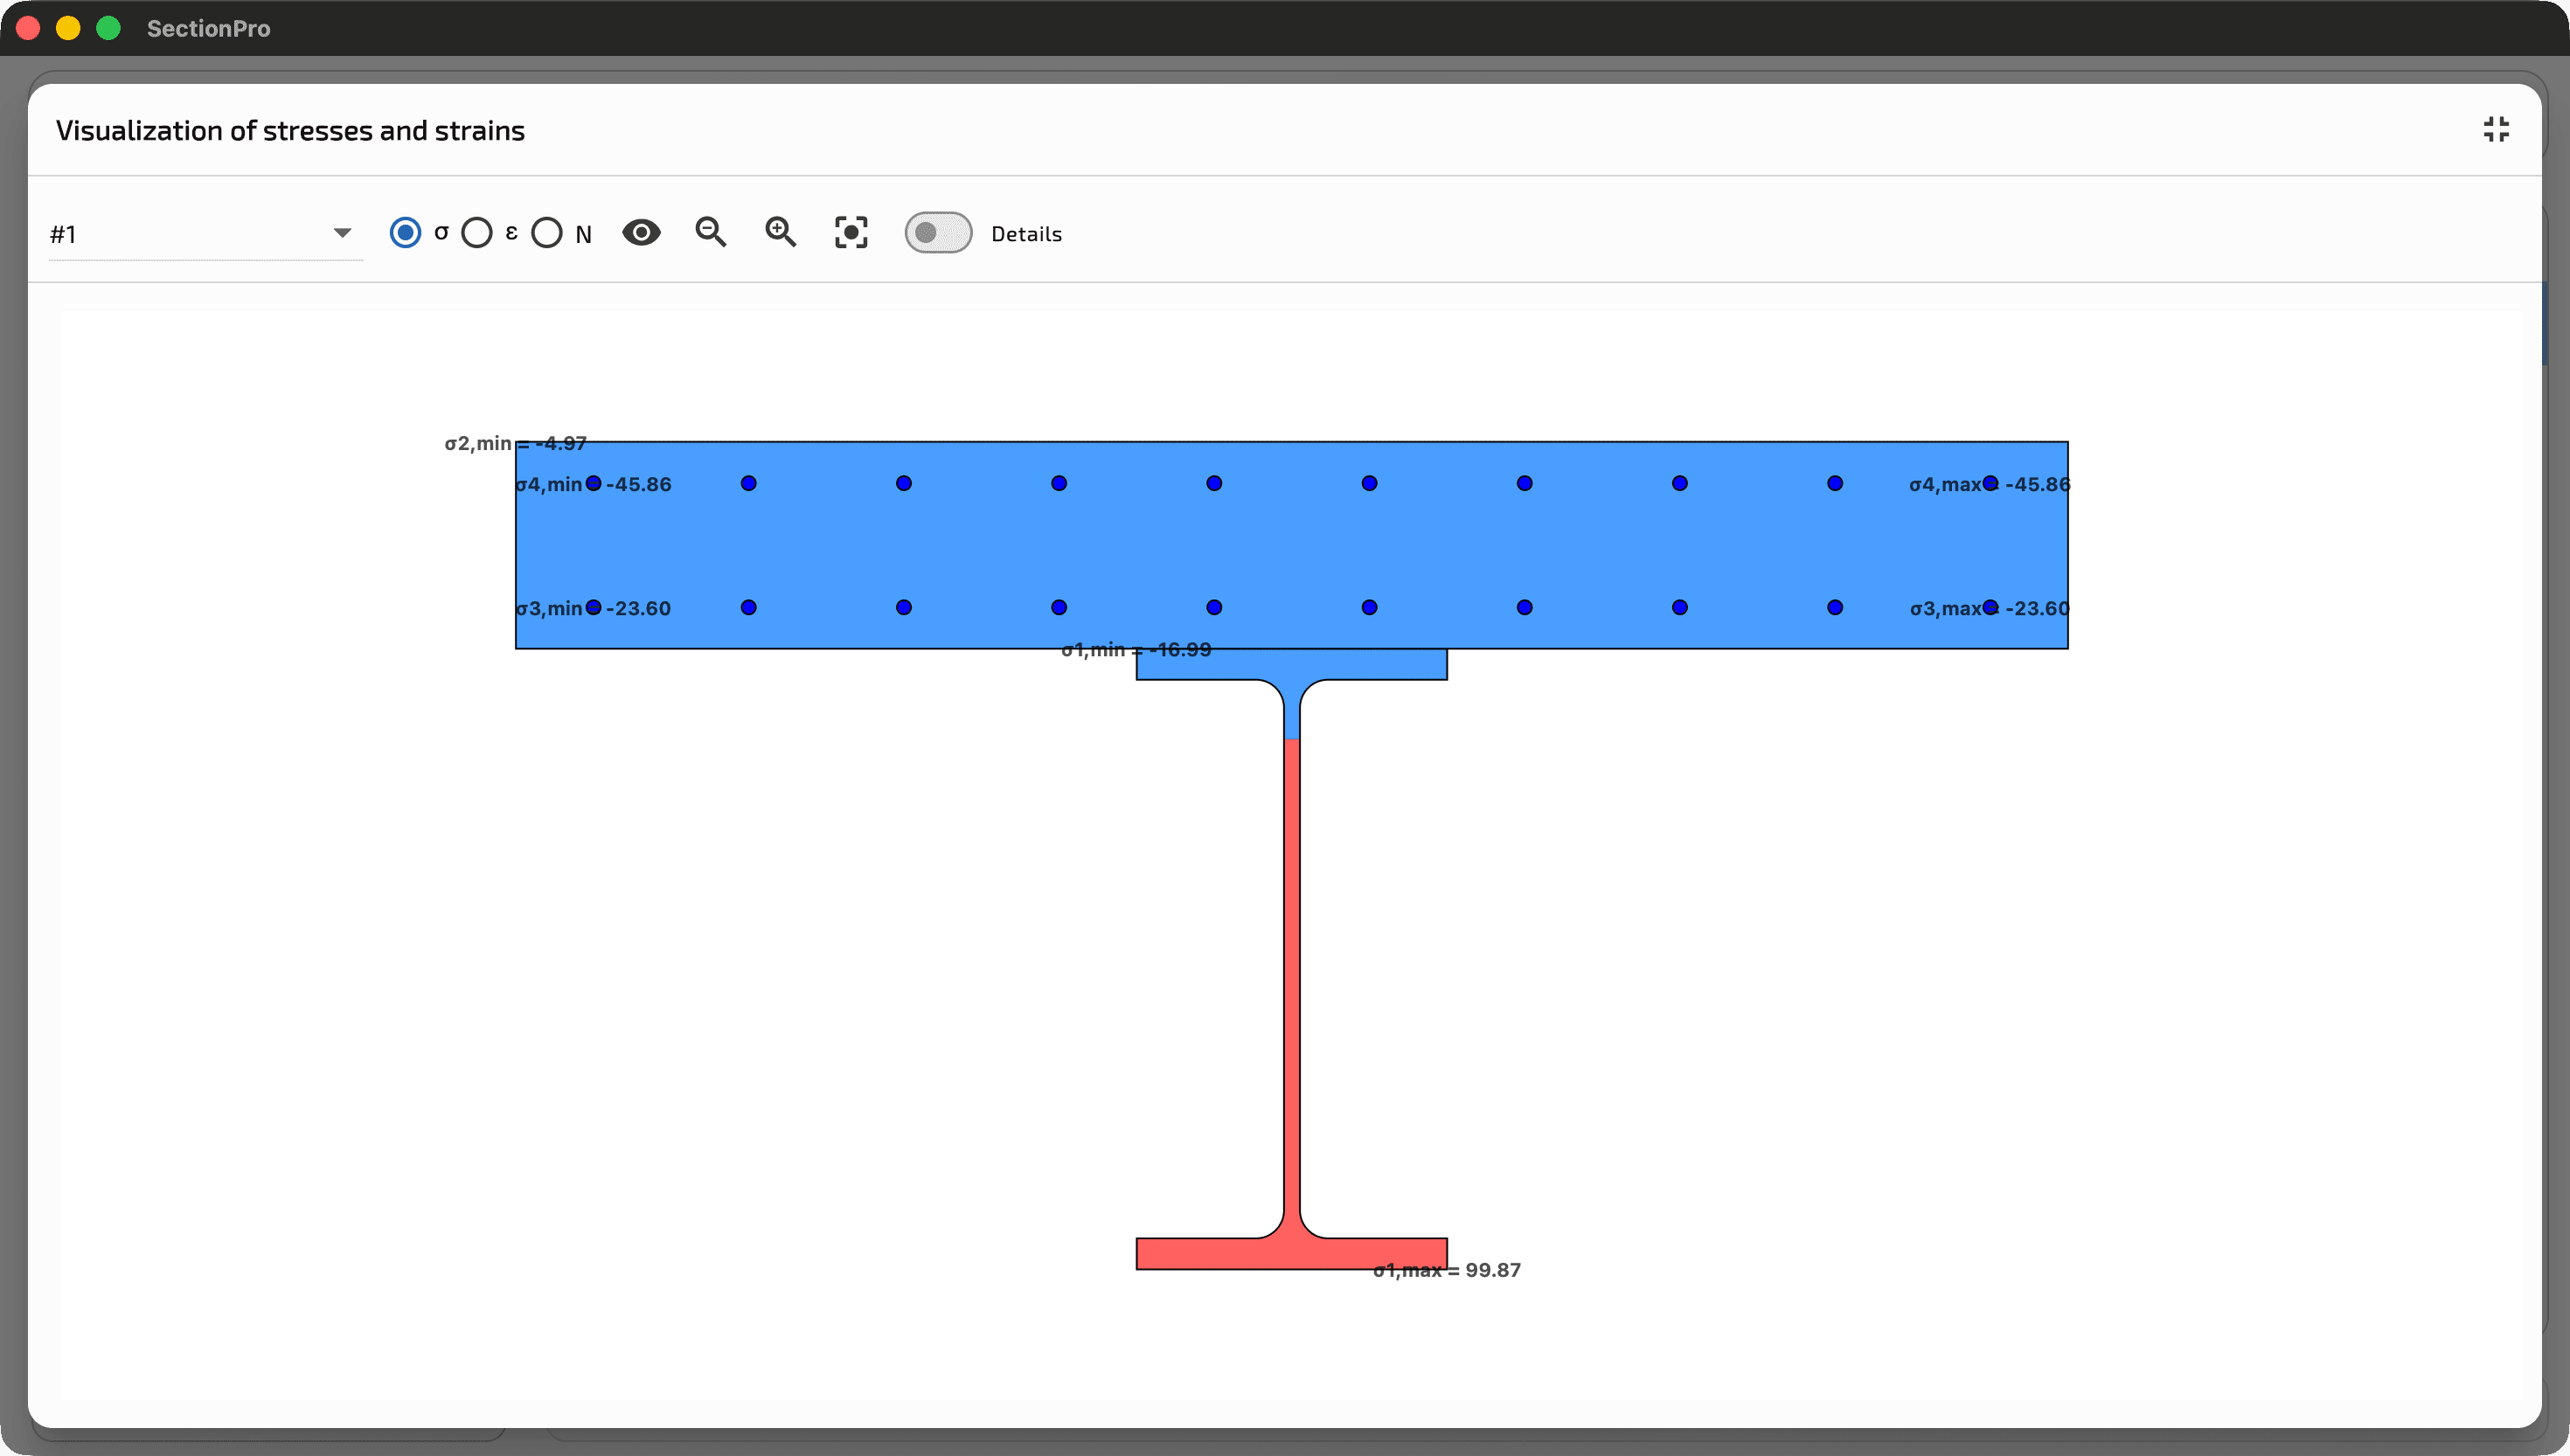
The neutral axis moves towards the slab. The HEB bottom flange reaches MPa and the top flange reaches MPa. Concrete compression ranges from to MPa. The lower and upper reinforcement layers reach and MPa respectively.
Stage C: slab shrinkage
A free strain ‰ is imposed on the slab GeoDomain with . The solver determines the strain state that satisfies global equilibrium of the composite section.
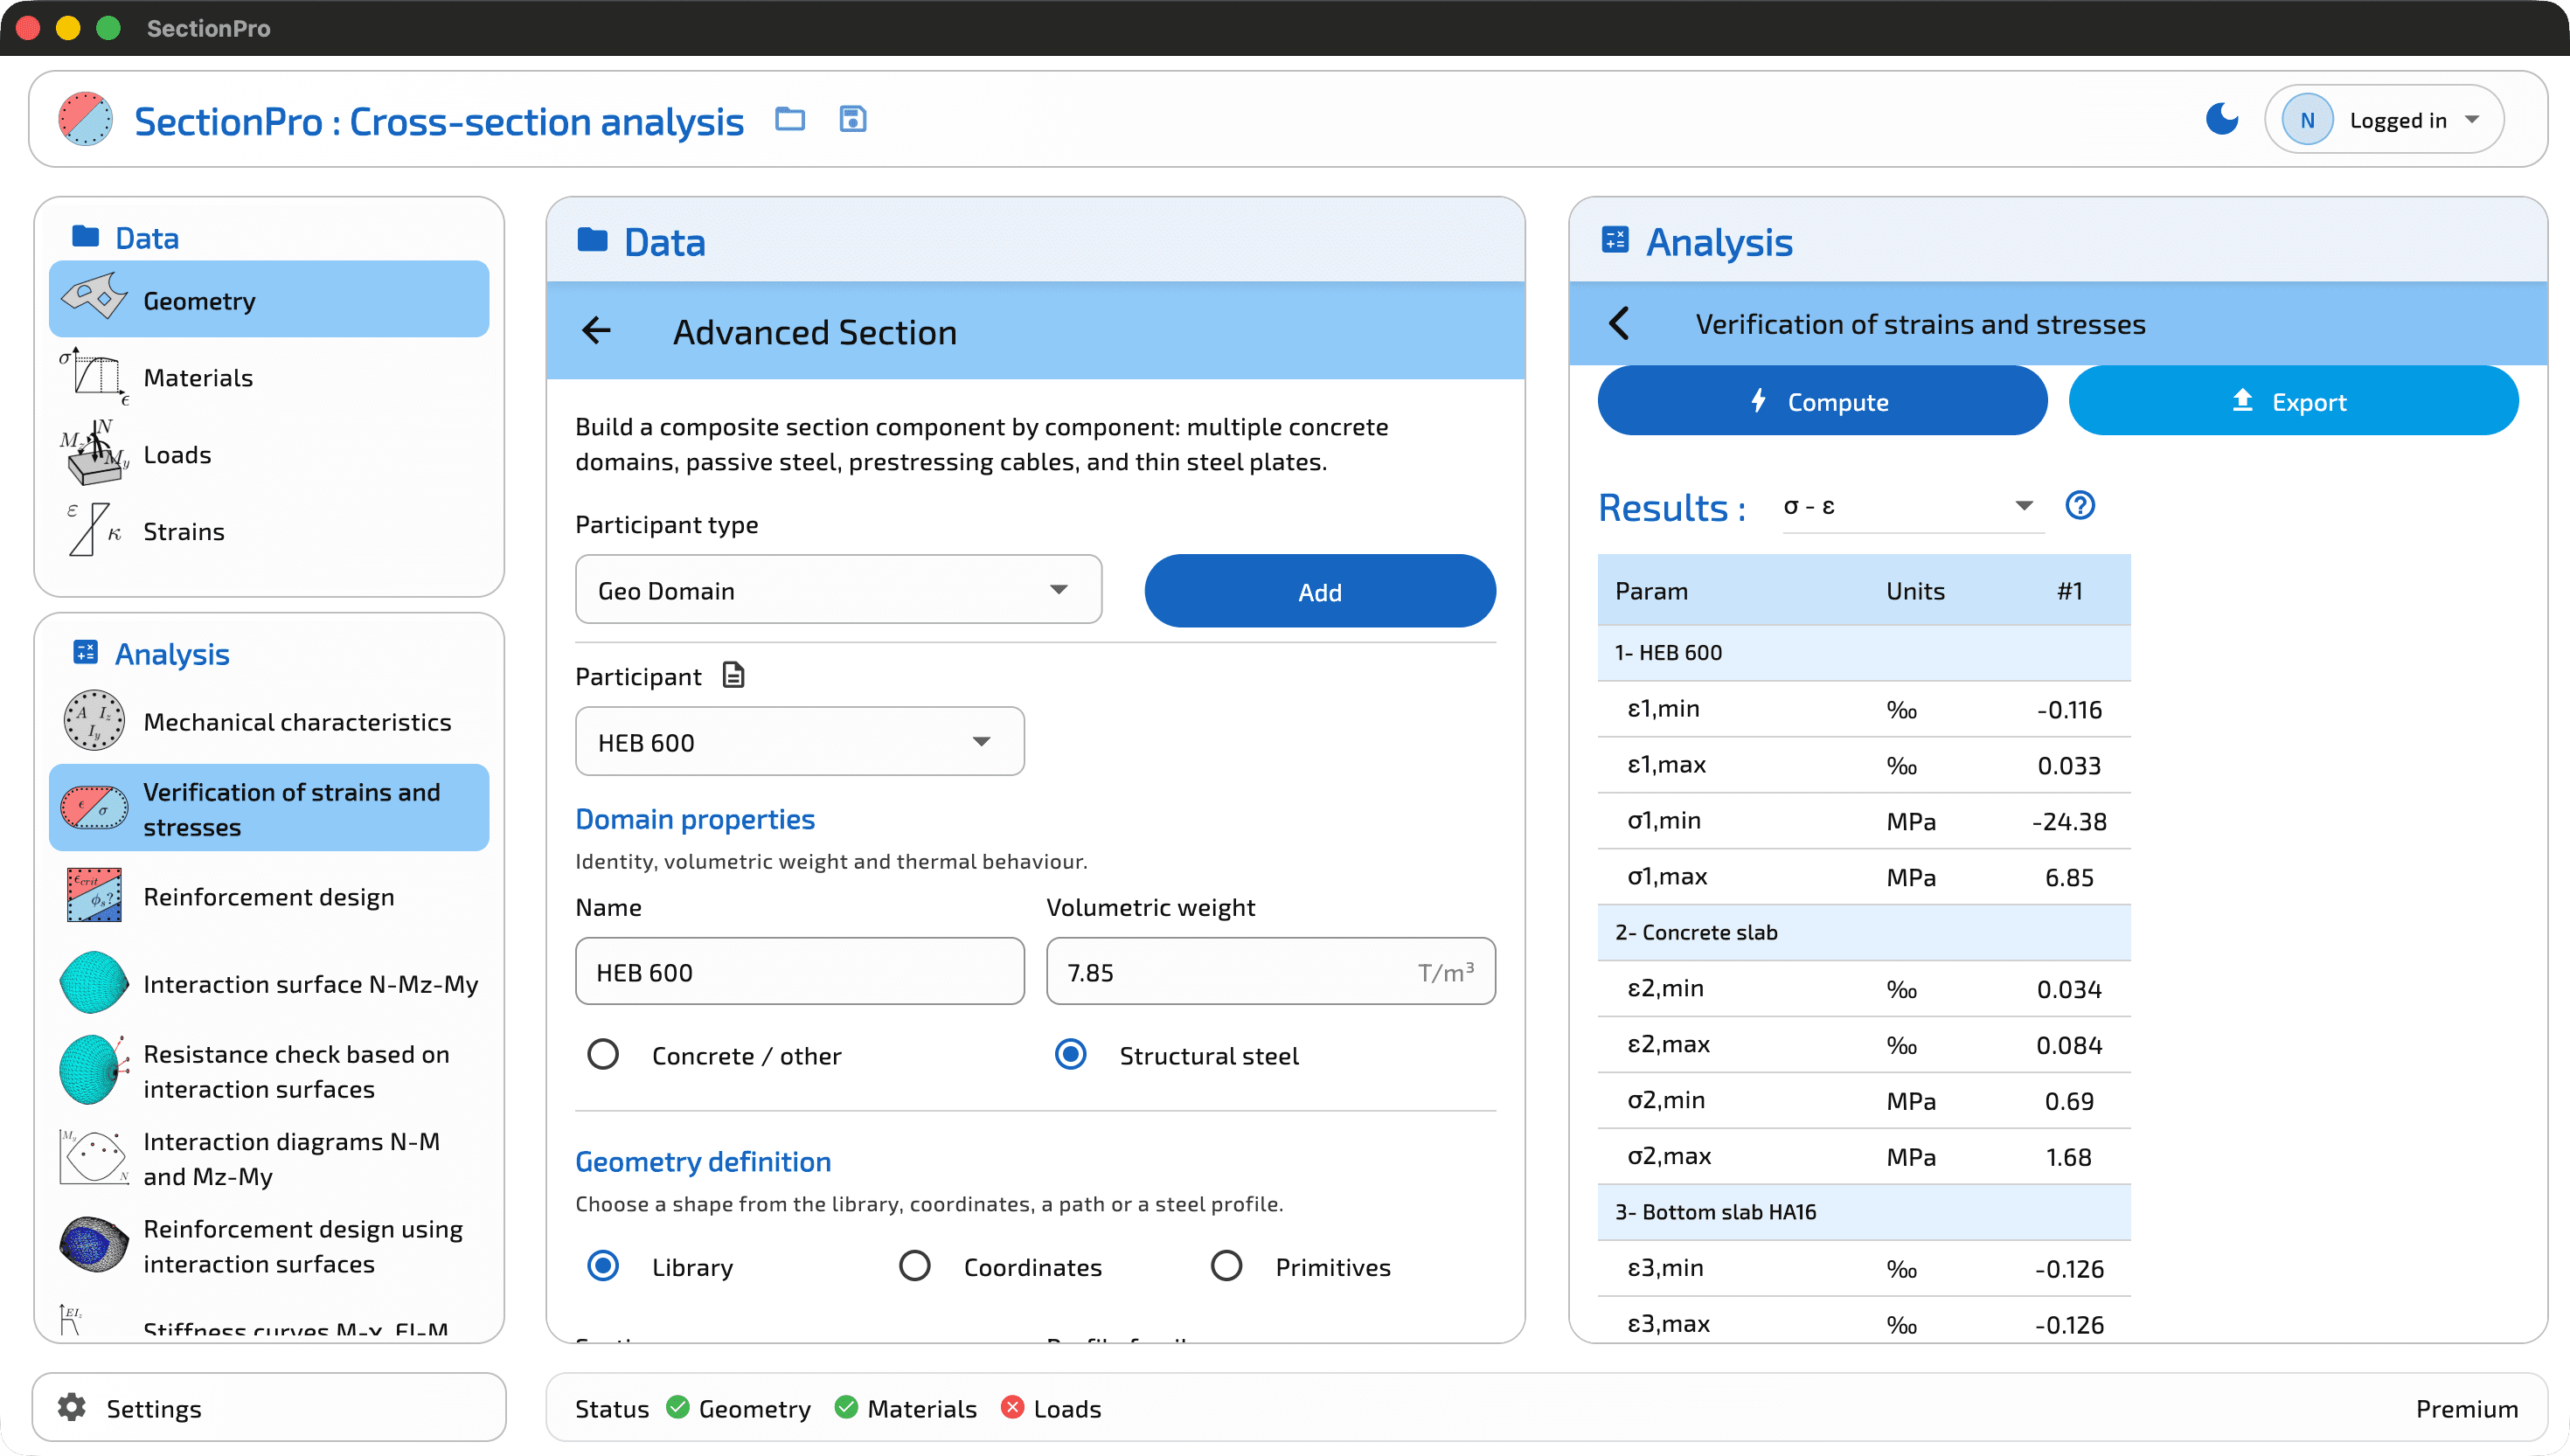
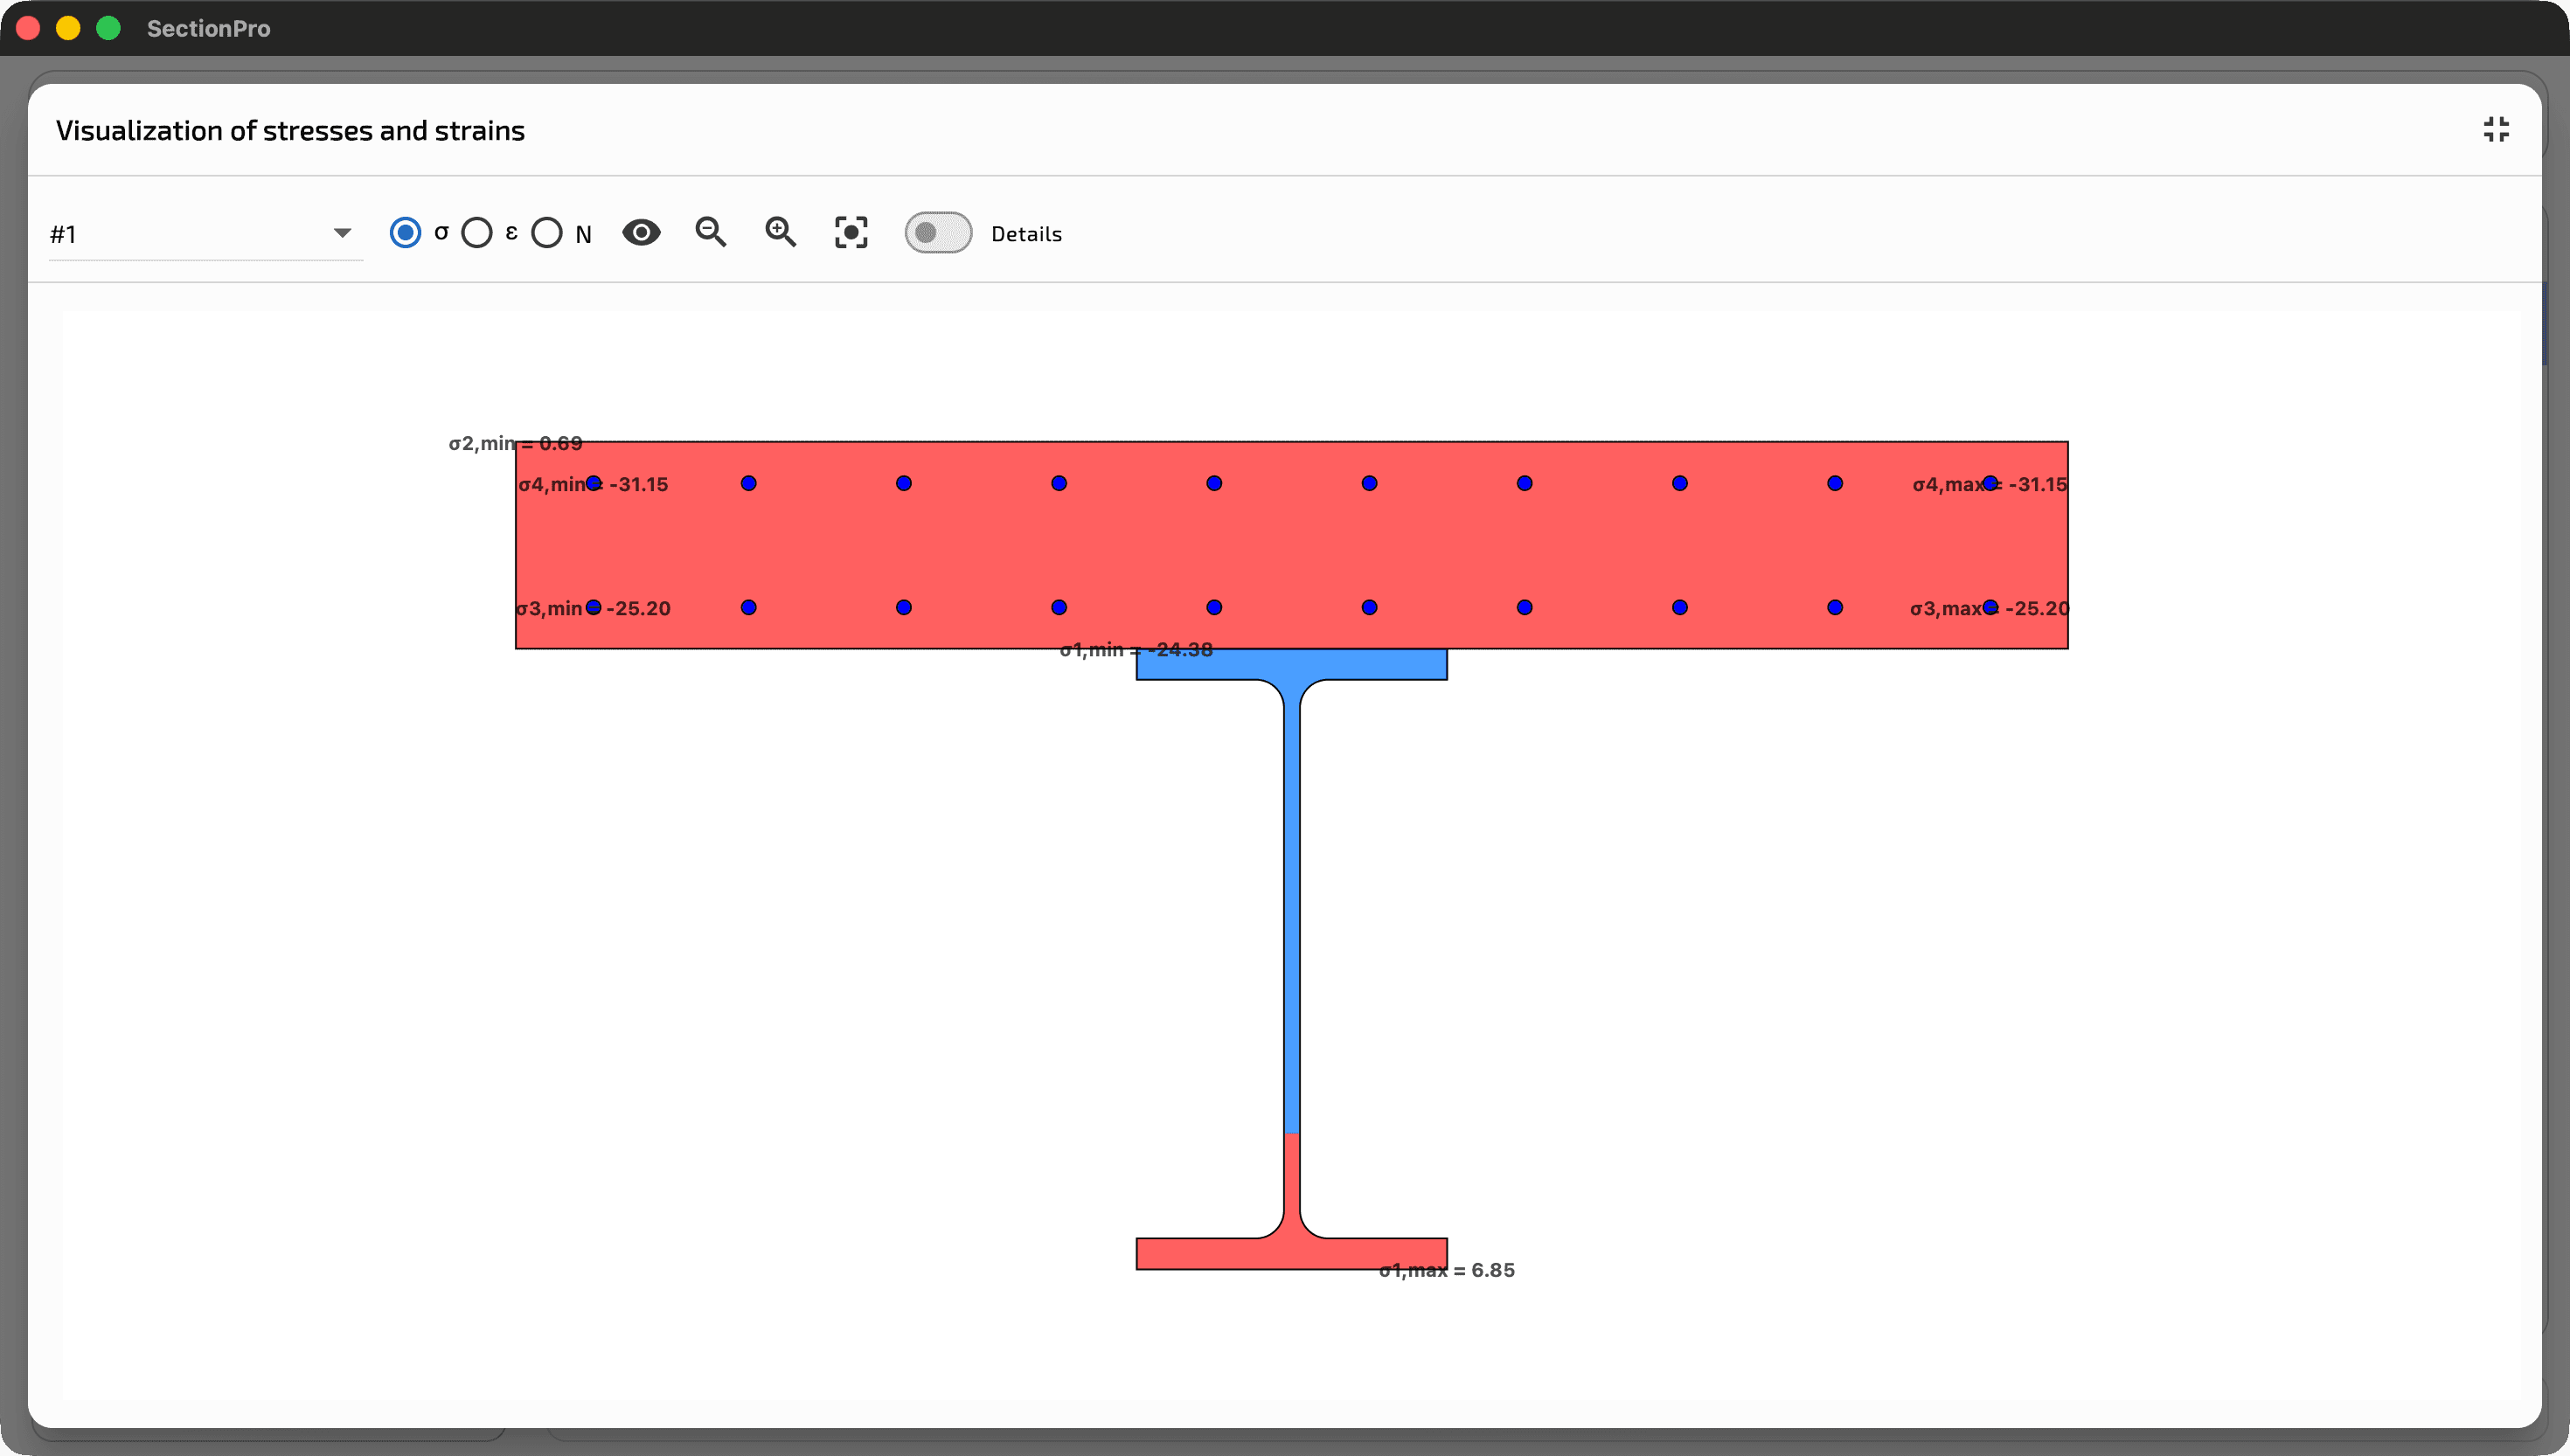
Concrete stress is obtained from the mechanical strain . Total slab strain ranges from to ‰. Restraint from the steel section and reinforcement produces concrete tension between and MPa. The HEB top flange reaches MPa. The two reinforcement layers reach and MPa.
Final stress state
The final stress at each physical location is obtained by superposing the three stage contributions:
| Location | ||||
|---|---|---|---|---|
| HEB bottom flange | +70.16 | +99.86 | +6.85 | +176.87 |
| HEB top flange | −70.16 | −16.99 | −24.38 | −111.53 |
| Slab soffit | 0.00 | −1.59 | +1.68 | +0.09 |
| Slab top face | 0.00 | −4.97 | +0.69 | −4.29 |
| Lower HA16 layer | 0.00 | −23.60 | −25.20 | −48.80 |
| Upper HA16 layer | 0.00 | −45.86 | −31.15 | −77.01 |
The construction sequence mainly affects the HEB. Its bottom flange accumulates tension from the two bending stages and the shrinkage effect. Its top flange retains the compression acquired before the slab hardened, then receives the composite-section and shrinkage contributions.
The following table compares this state with 1,200 kN·m applied to a composite section active from the first load step.
| Location | Staged analysis | Composite section under 1,200 kN·m |
|---|---|---|
| HEB bottom flange | +176.87 MPa | +150.19 MPa |
| HEB top flange | −111.53 MPa | −26.35 MPa |
Both calculations correspond to the same total moment. Their stress states differ because the first 400 kN·m are carried by the HEB before slab activation. The staged analysis preserves this sequence in the final stresses.
– interaction curves
The interaction curves are calculated at the ULS for . The first configuration contains the S355 HEB 600. The second combines the steel section, C30/37 slab and twenty B500 bars.
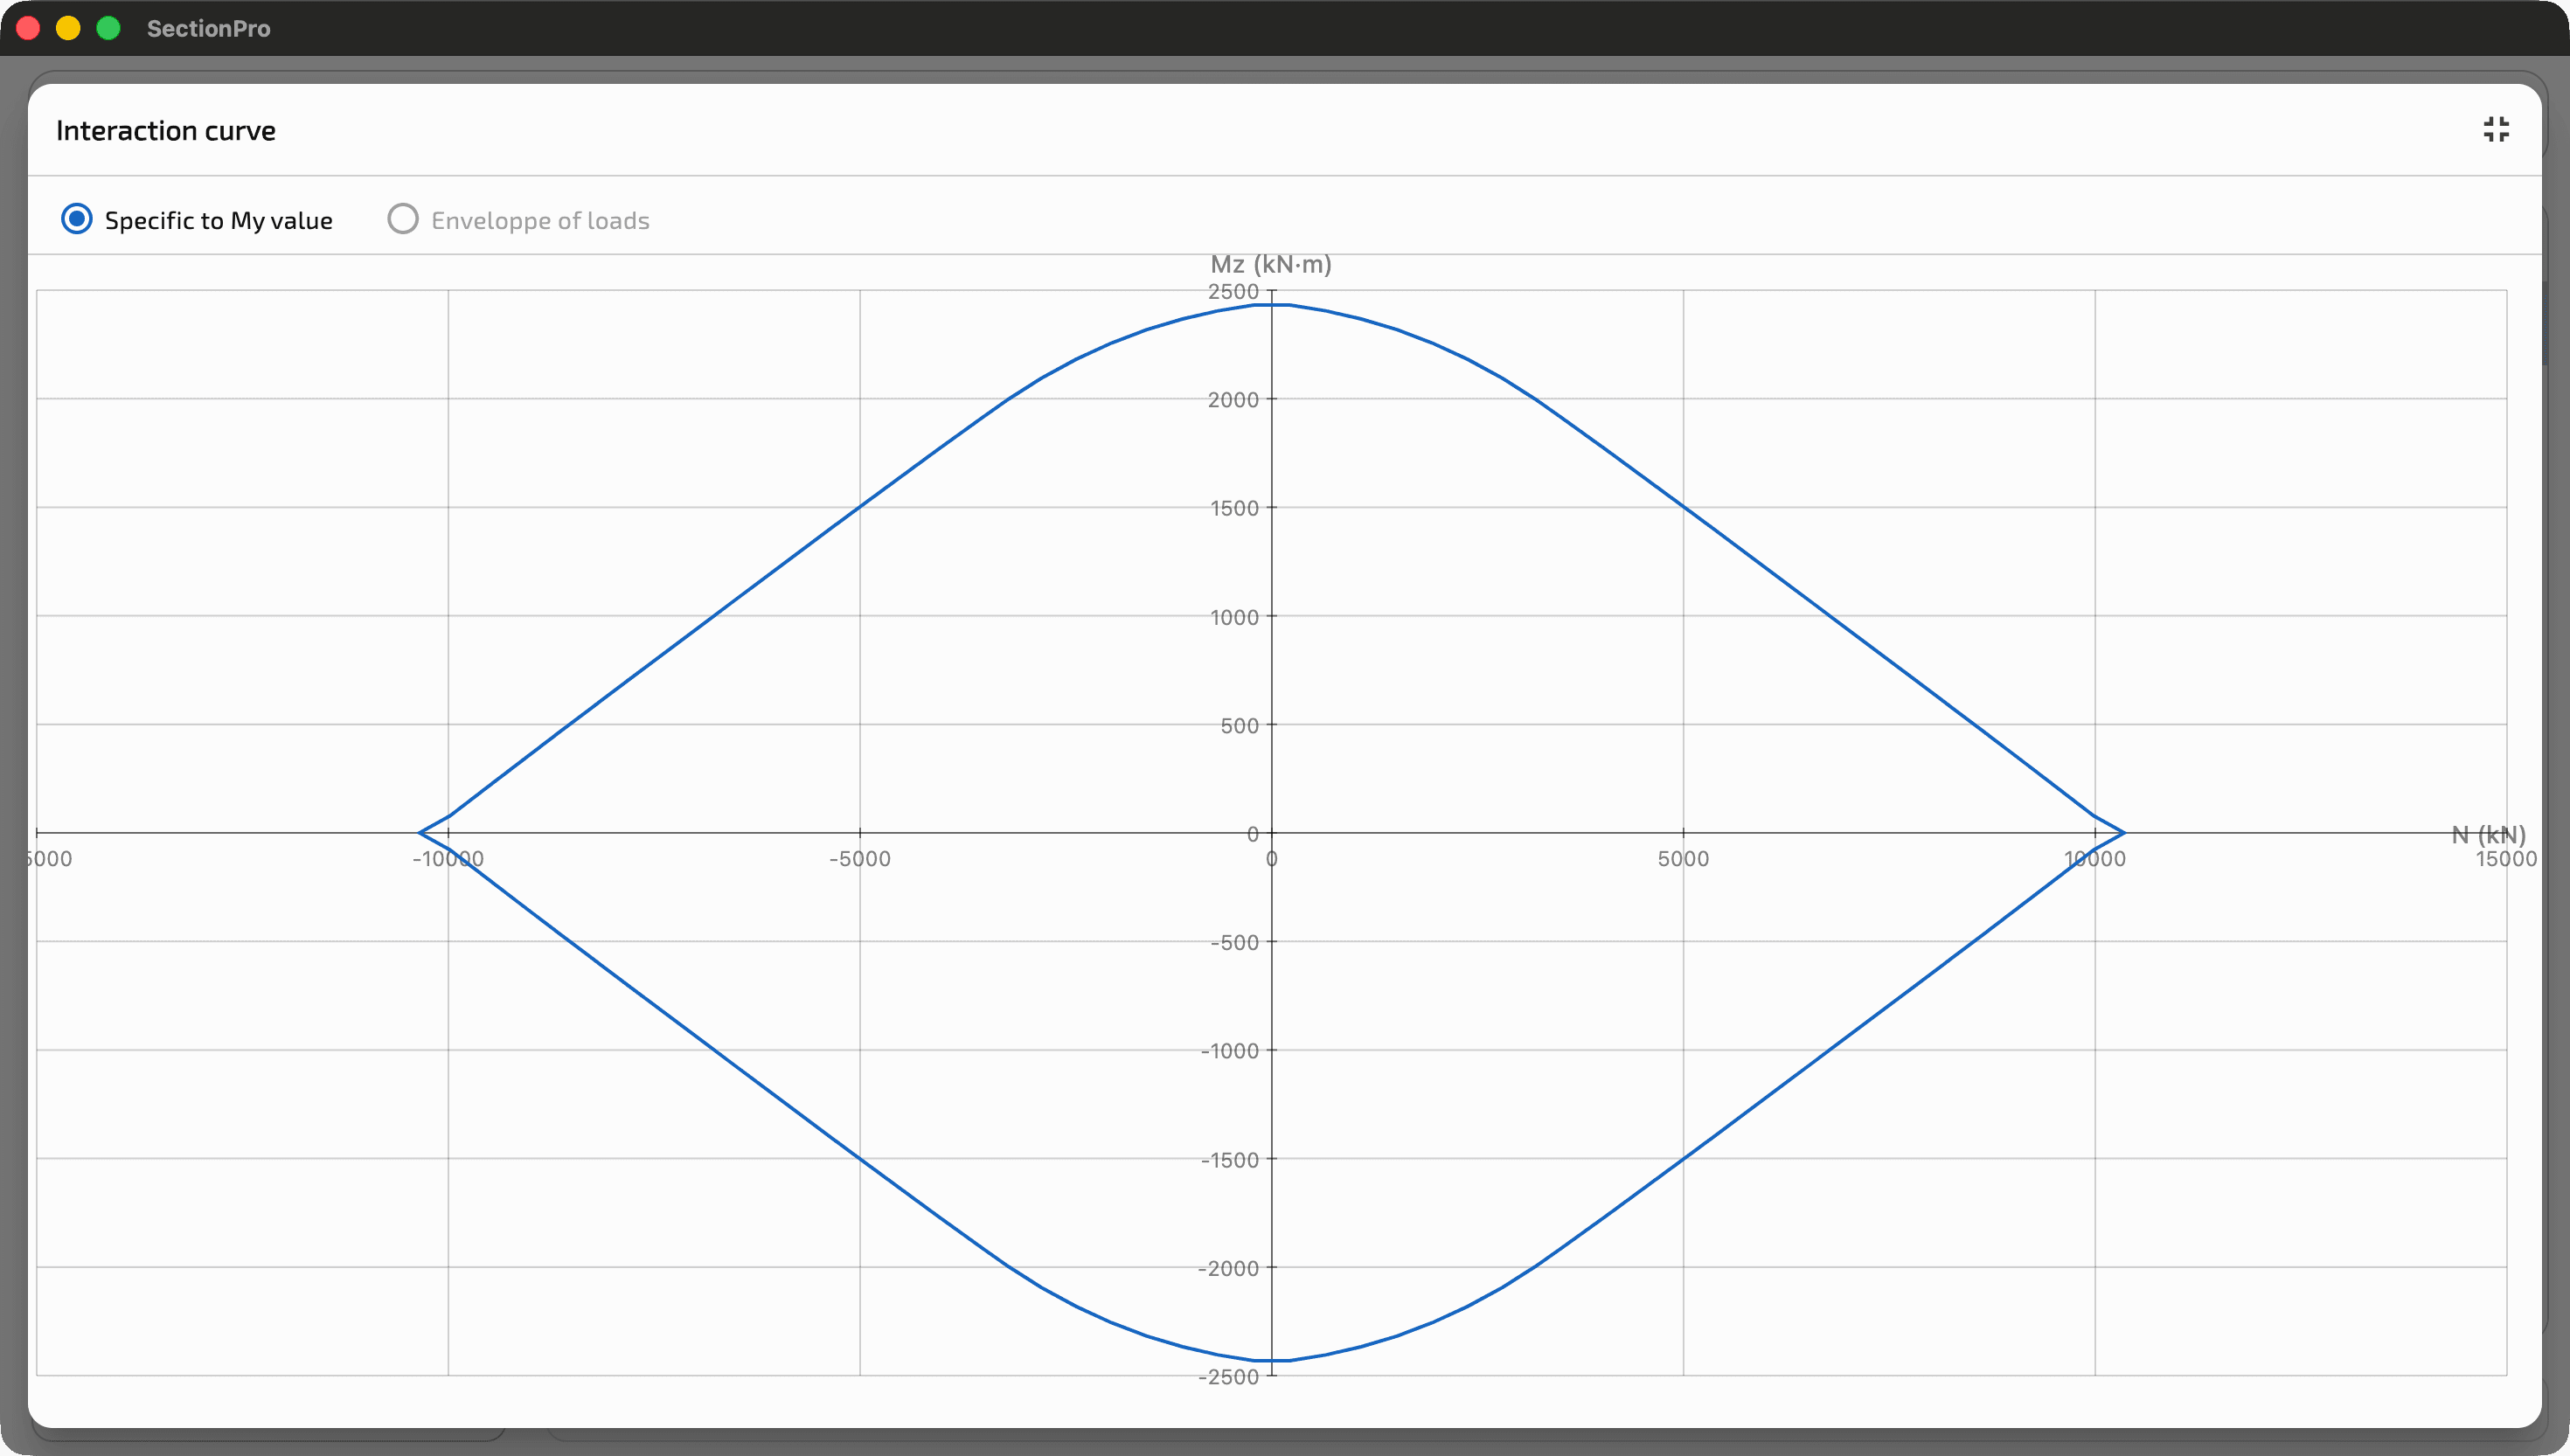
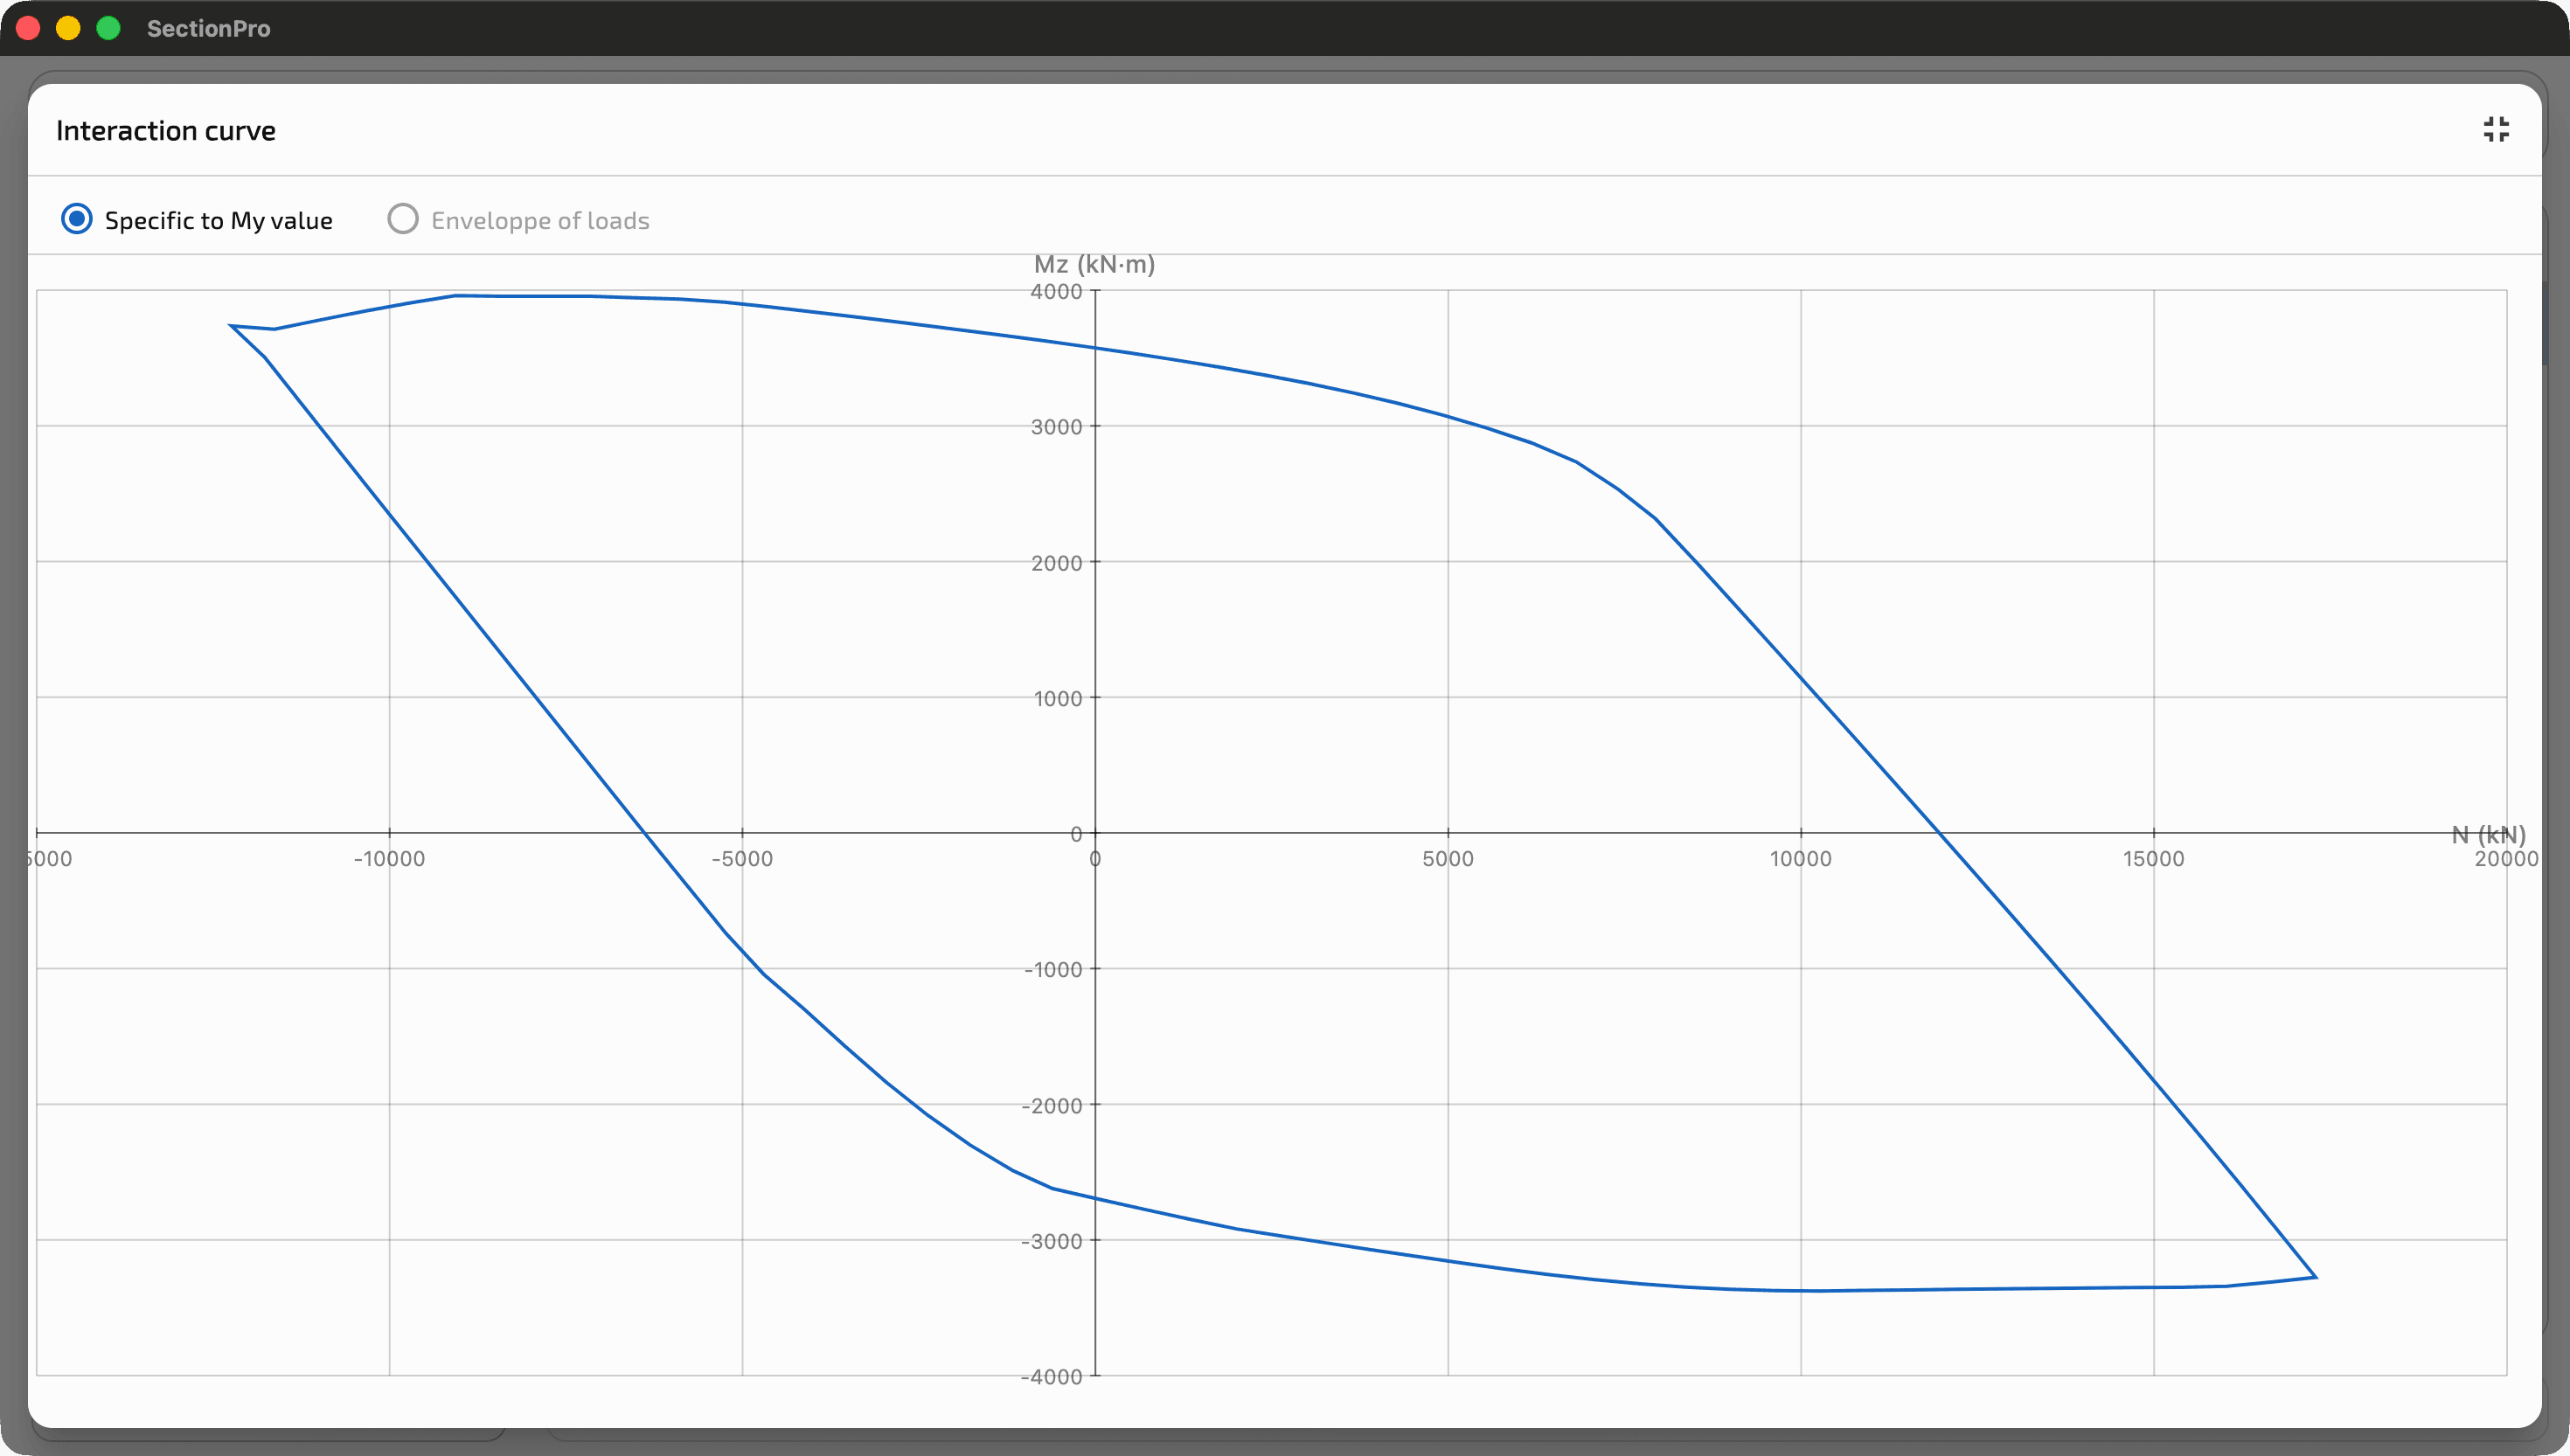
The table gives the four bounds of each curve. The end ticks on the axes only define the plotting window; the curve extrema are the values reported below.
| Component | HEB 600 | Composite section | ||
|---|---|---|---|---|
| Min. | Max. | Min. | Max. | |
| [kN] | −10,351 | +10,351 | −12,240 | +17,118 |
| [kN·m] | −2,442 | +2,442 | −3,376 | +3,959 |
Under the adopted sign convention, positive denotes compression. Adding the reinforced concrete slab therefore raises from +10,351 to +17,118 kN: the increase in compression capacity comes from the concrete area added above the steel section. For , the bounds change from −2,442 and +2,442 kN·m to −3,376 and +3,959 kN·m. This asymmetry also reflects the position of the slab above the steel section.
Performance
The table below gives the execution times of calls to the SectionPro kernel. These values exclude the graphical interface and result rendering.
| Analysis | Calculation time |
|---|---|
| Stage A, HEB under 400 kN·m | 29.0 ms |
| Stage B, composite section under 800 kN·m | 26.3 ms |
| Stage C, slab shrinkage | 23.9 ms |
| HEB – curve, 242 points | 75.4 ms |
| Composite – curve, 242 points | 79.6 ms |
Each stress state is solved in less than 30 ms. Both 242-point interaction curves remain below 80 ms. These calculation times allow section configurations and load variants to be evaluated in rapid succession.
Conclusion
The SectionPro structural steel library provides ready-to-use geometries with their actual dimensions, curved transitions and fillets. Advanced mode directly combines these sections with concrete domains and reinforcement layers.
The HEB 600 example shows how the construction sequence affects stress distribution. The steel section carries the first moment, the composite section carries the following increment, and slab shrinkage restrained by the steel section and reinforcement creates a self-equilibrated stress state. Final stresses retain the contribution of each stage at the same physical locations.
The – curves complement this analysis with a ULS resistance assessment. Changing from the HEB to the composite section expands the bounding box in all four directions and introduces the asymmetry associated with the top slab.